
Waybop Tangle Infographics

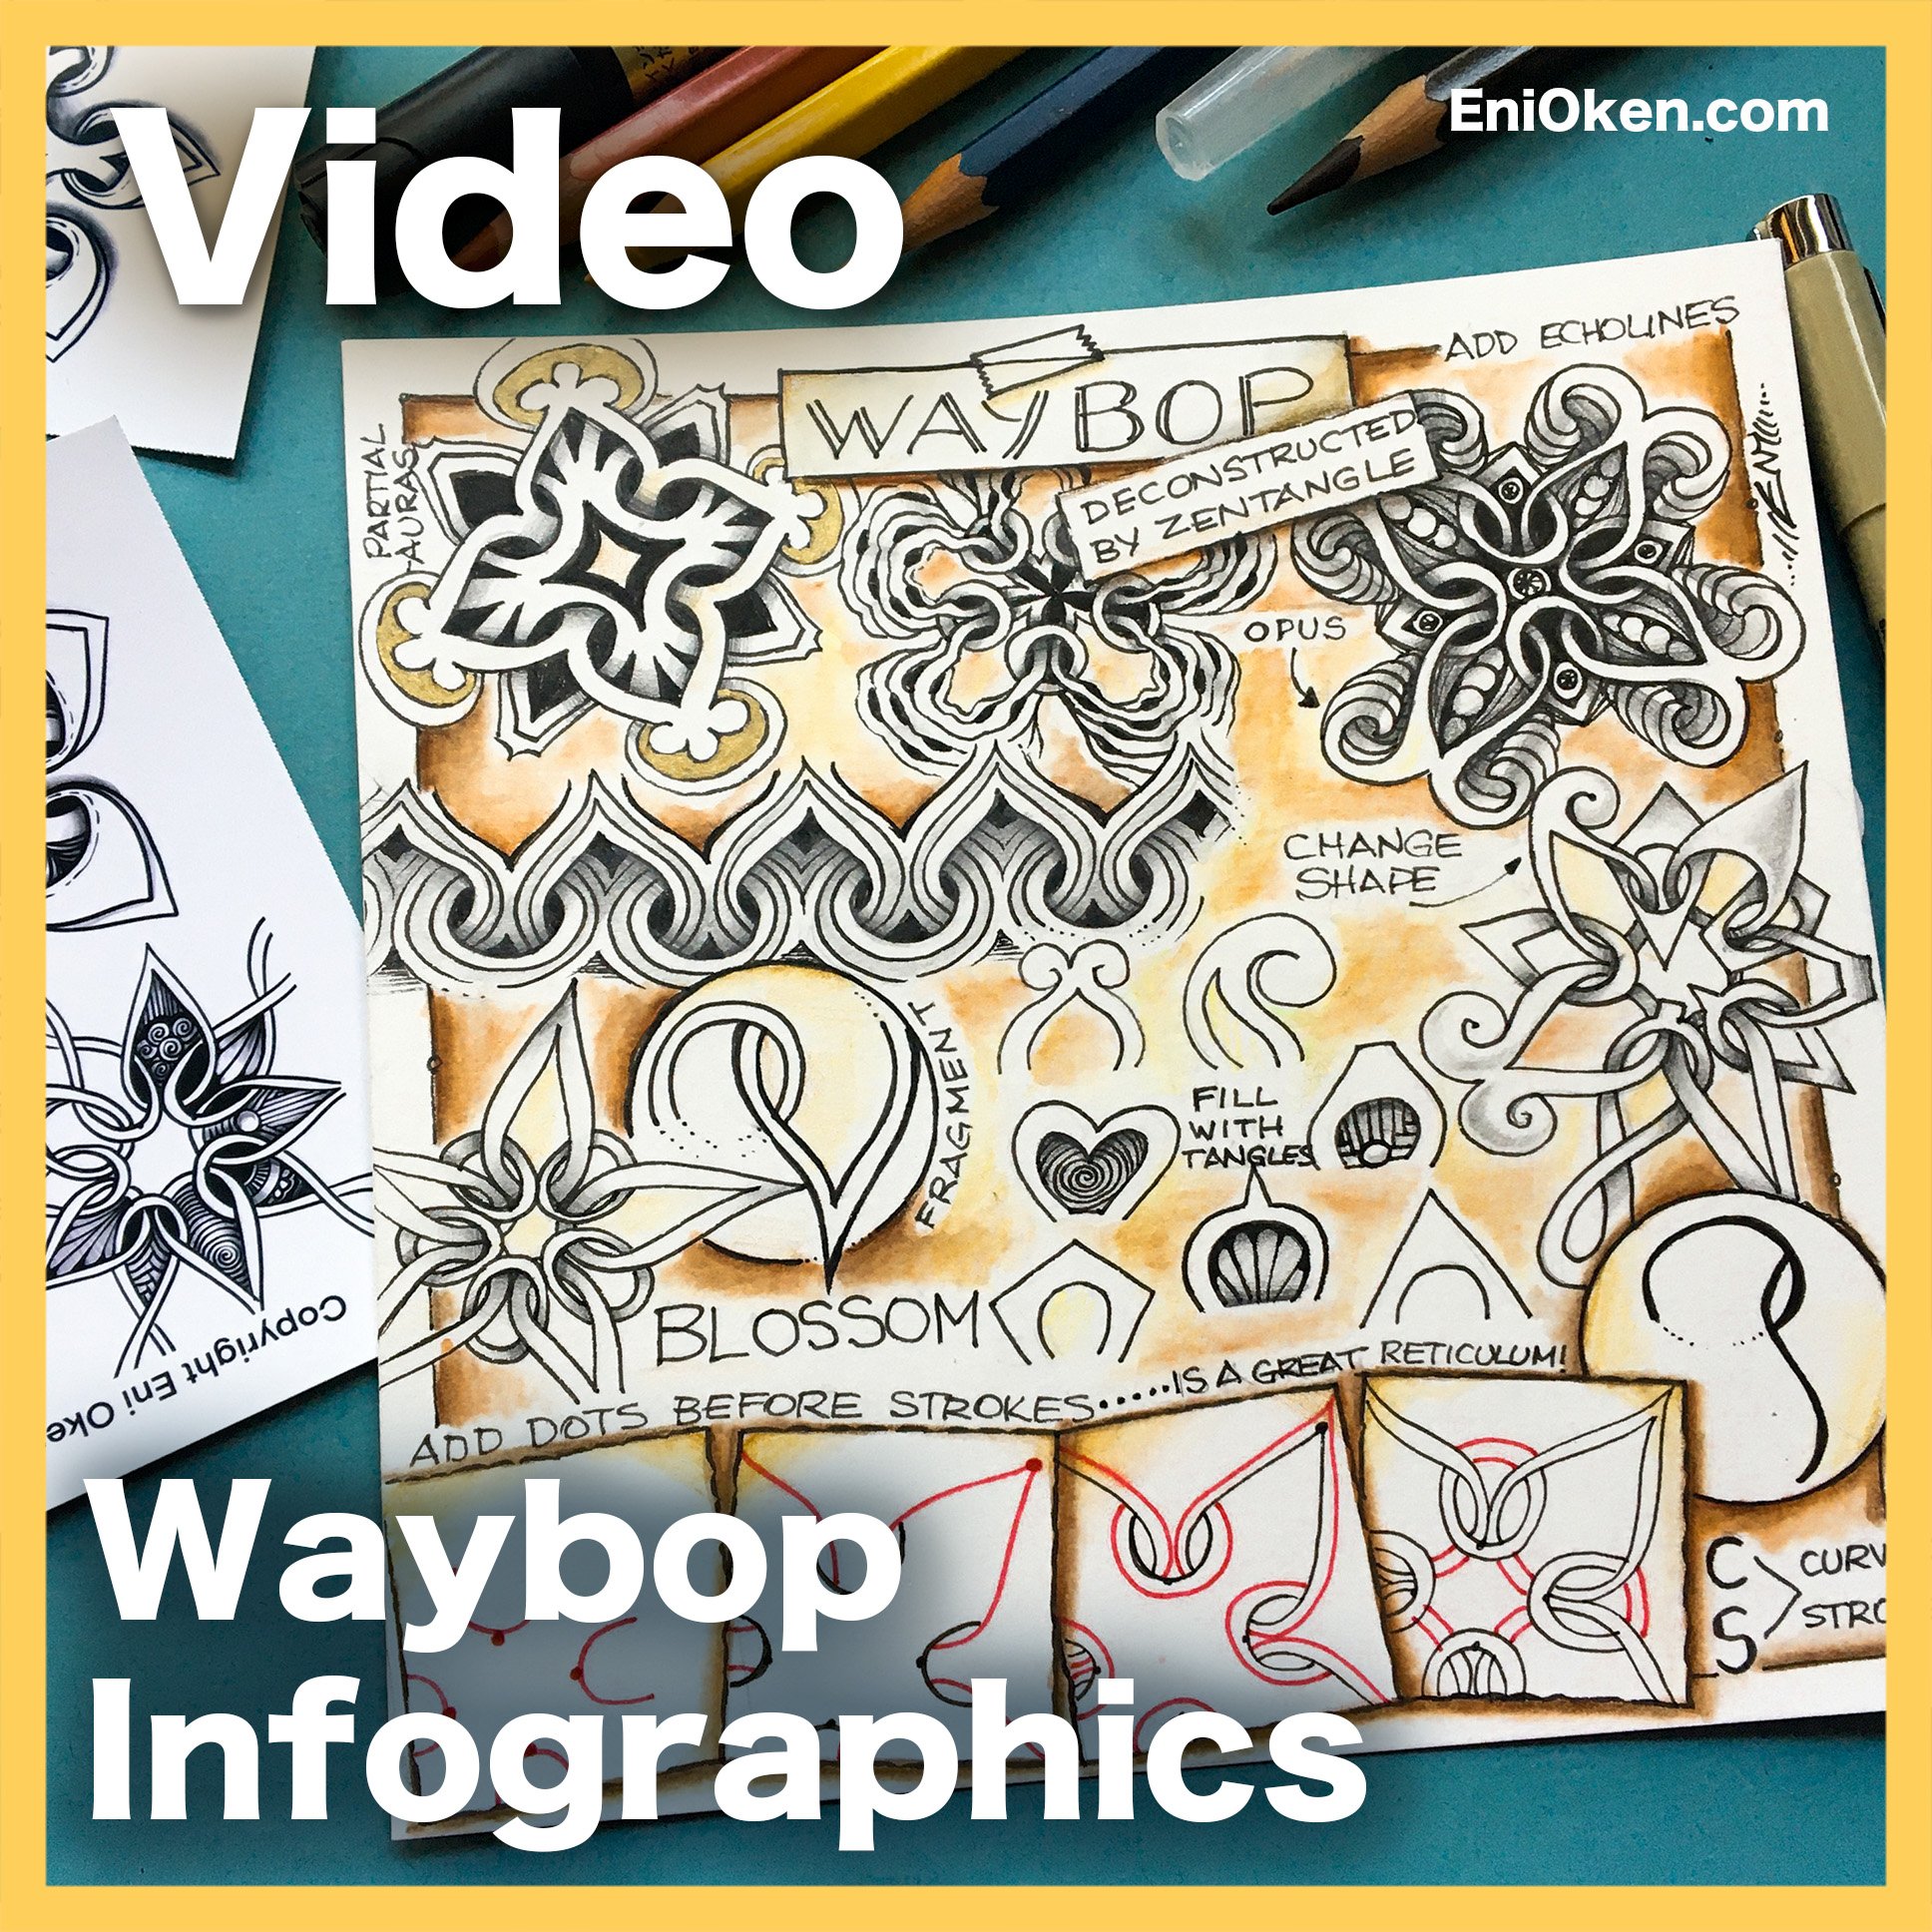
Today Art Clubbers and I finished the 3-part series on how to create “Tangle Infographics”, an exploratory journey where we dissected, analyzed and classified the tangle Waybop (Zentangle). What a SUPER FUN journey it was. The results that we came up with were far more interesting if we had done it individually, our collective experience was rich and full of options.
I developed a process of creating a Tangle Infographic that followed a very set method, with distinct phases.

During Parts 1 of the series, we started by developing the step-out. During this apparently simple phase, a number of discoveries came to light. During Part 2, we analyzed and classified the tangle according to structure and stroke.
Since our classes were spaced out by a week, we had plenty of time to explore and try out new things. We took the time inbetween classes to post on our facebook group and explore different options. By working in a group we were able to build on each other's ideas.
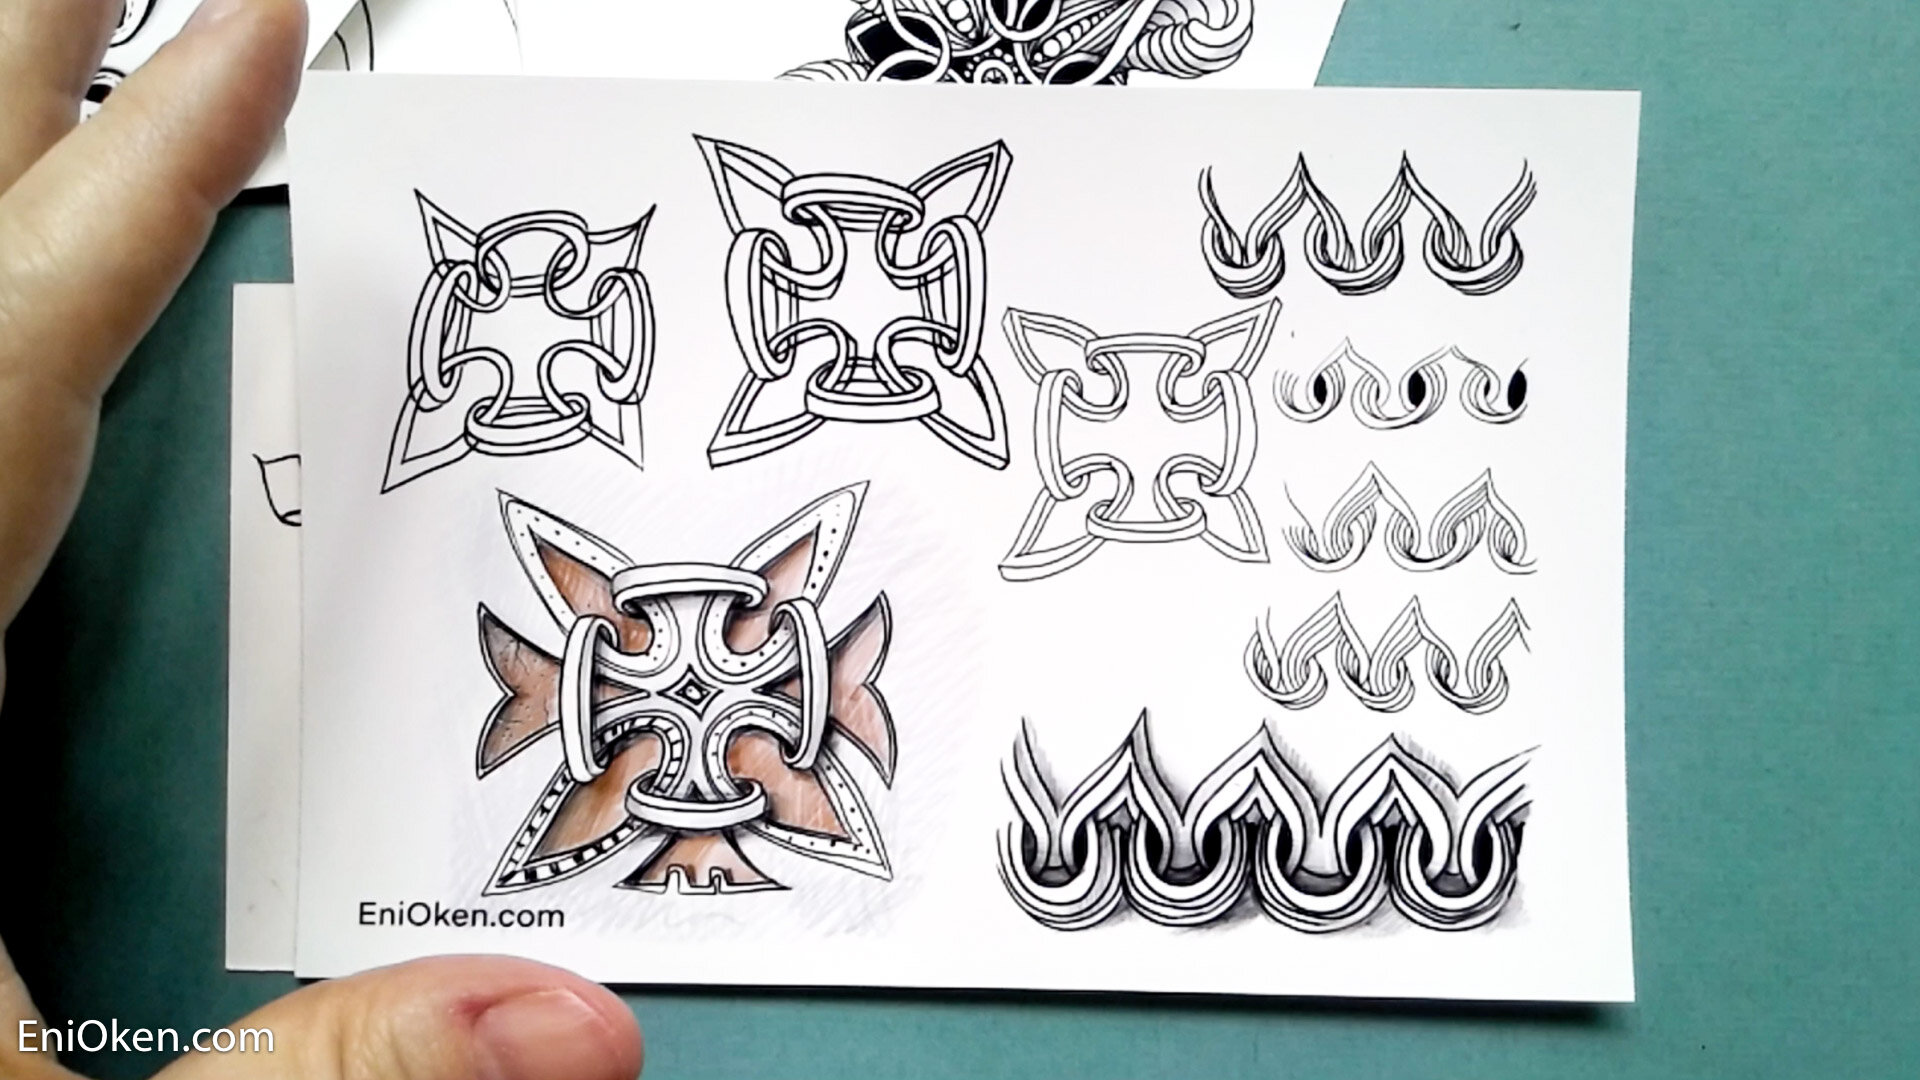
Look at all these variations! these are just a few of the ones that I drew and collected. There were an incredible amount of options developed by the group.

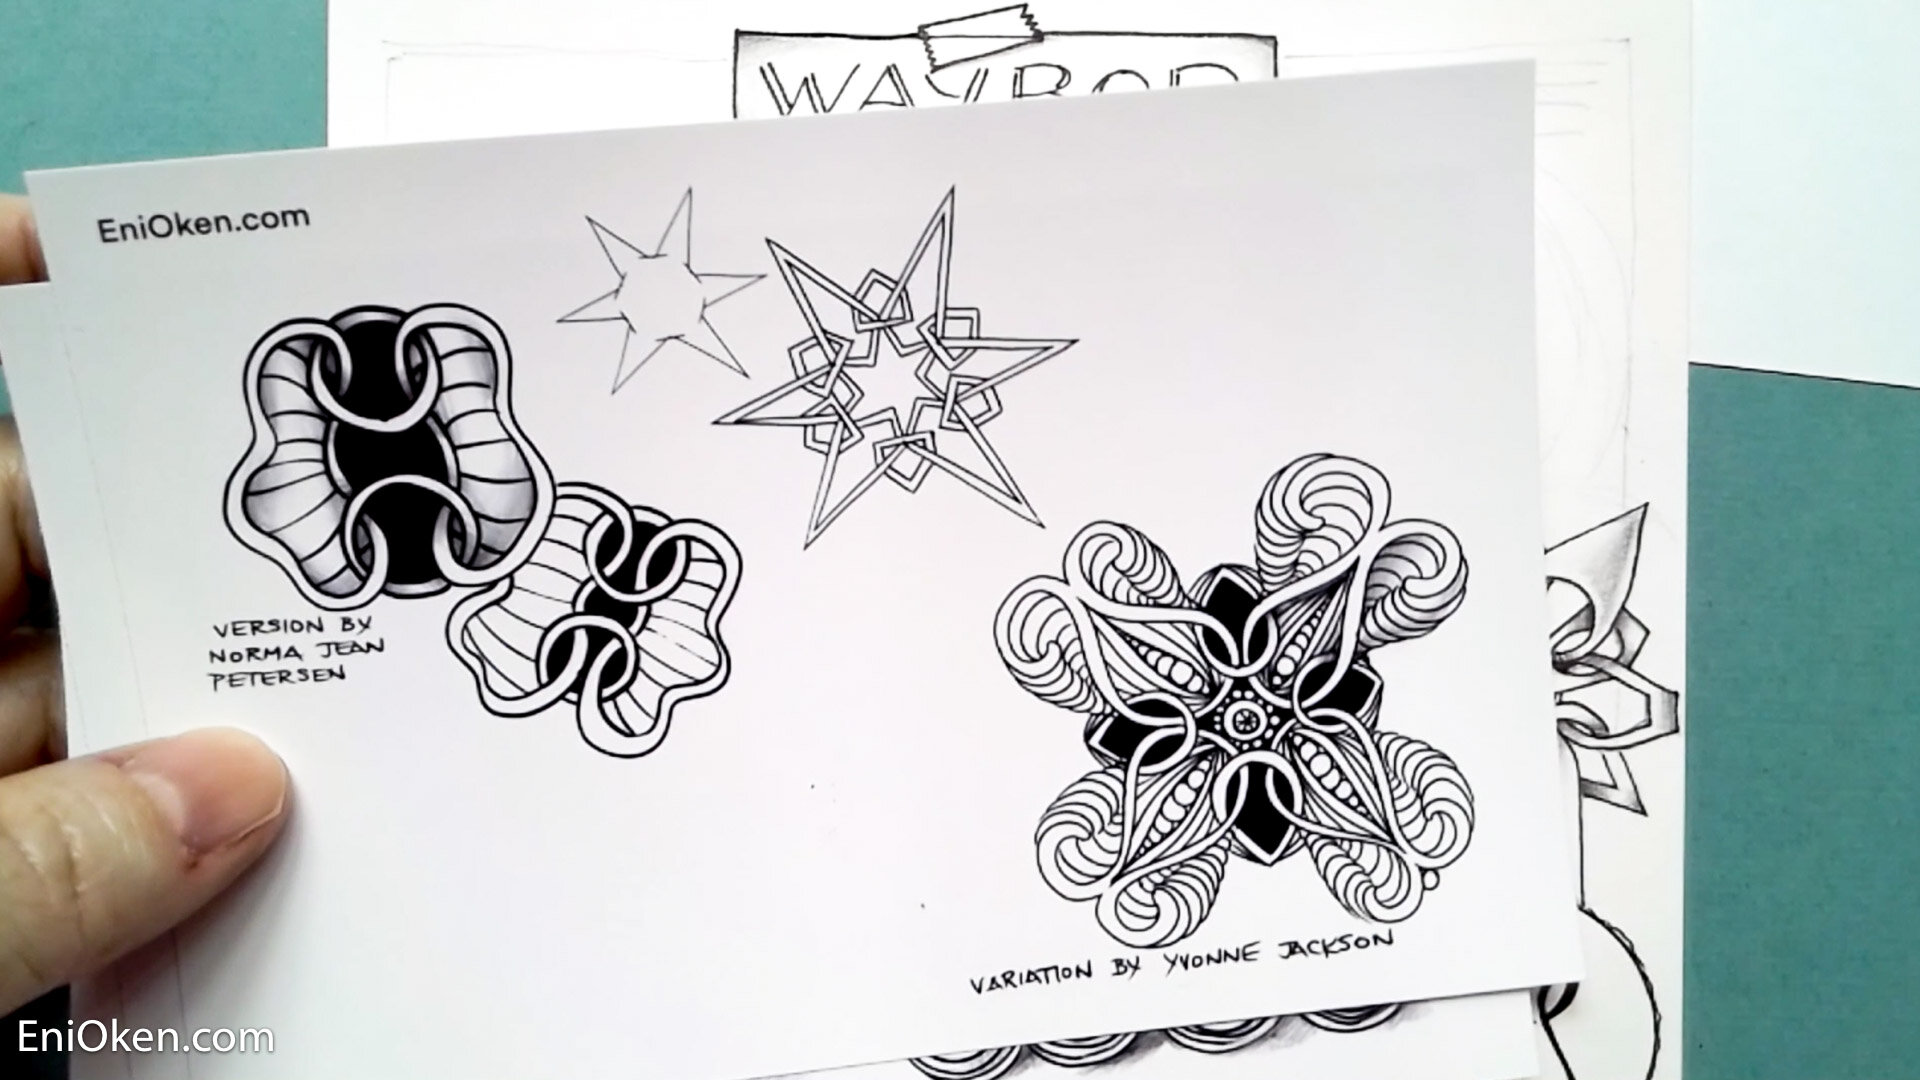
Here are a couple more developed by two clubbers, Norma Jean Petersen and Yvonne Jackson.
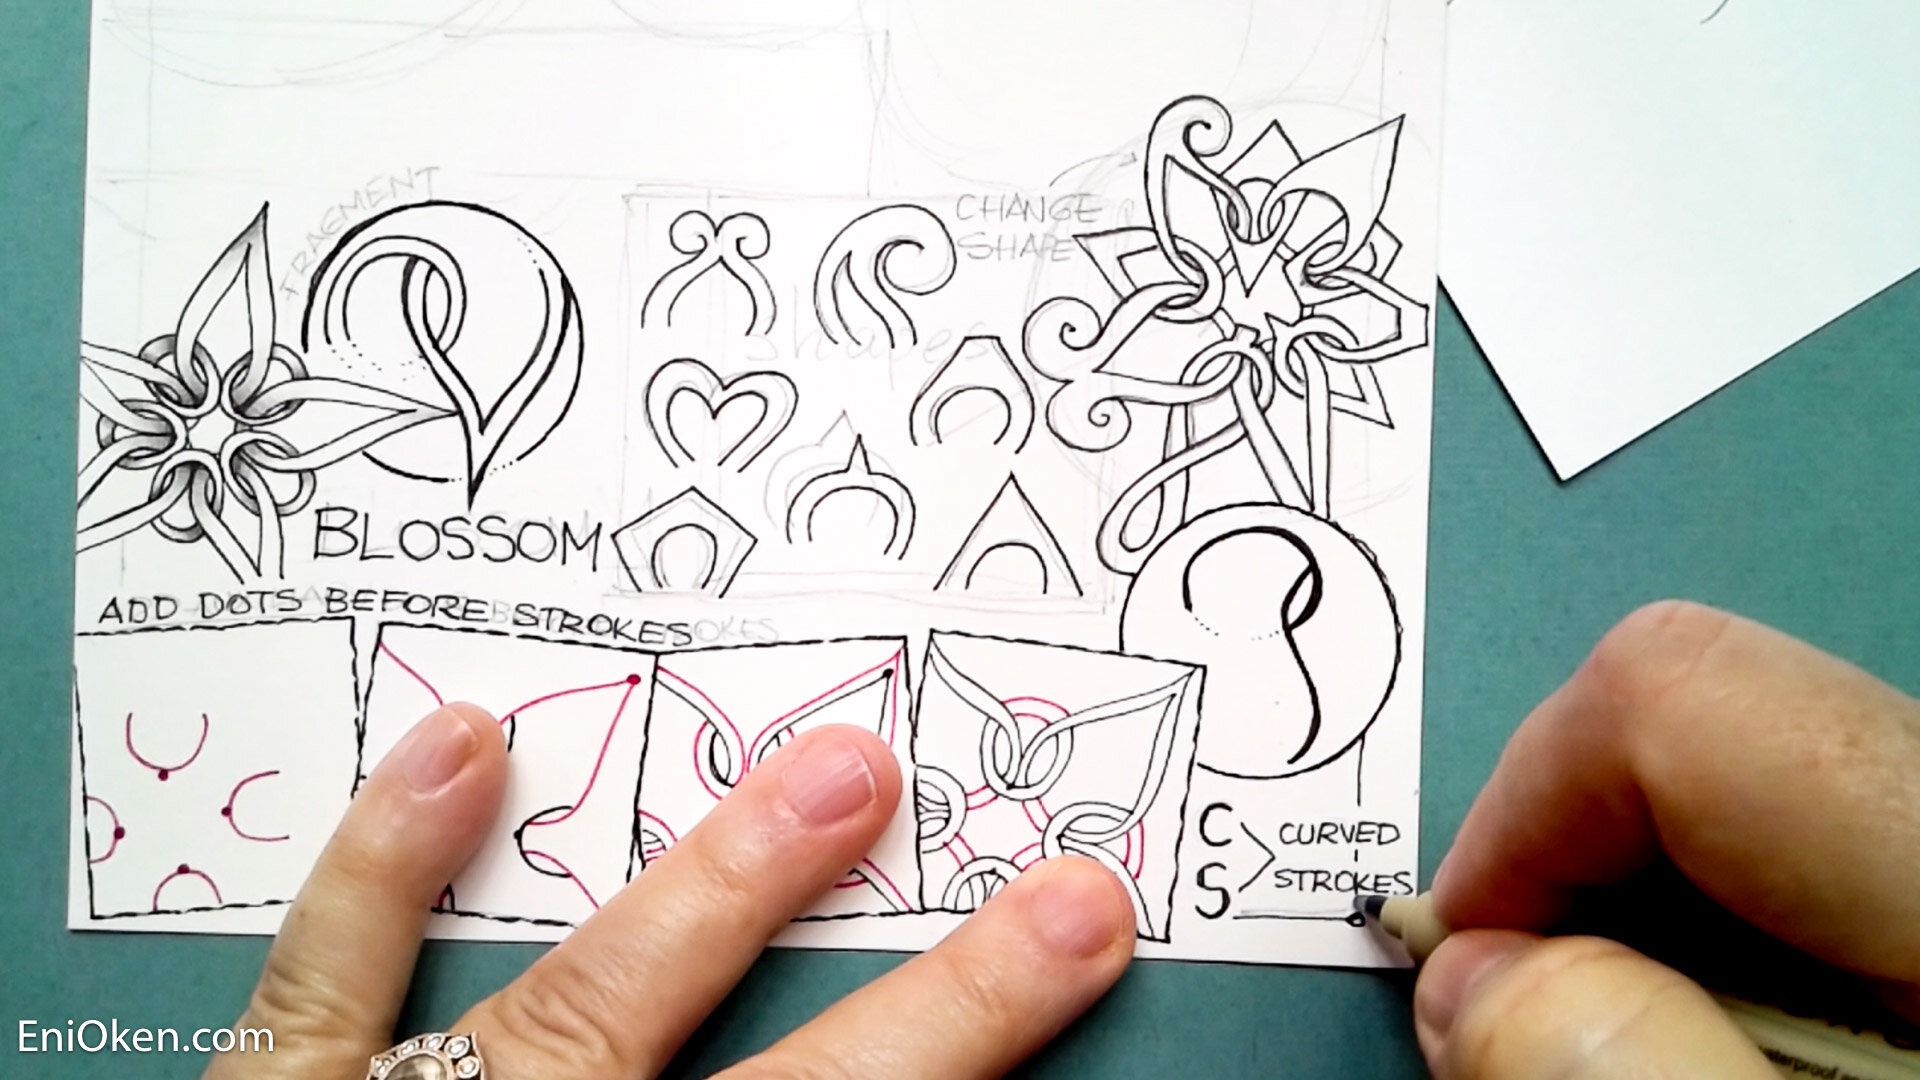
Today, on the third part of our series, we chose a few to add to the infographics card. You can see how this sample uses different shapes instead of circles and domes.

Here you can see how the card got filled up with a few more samples. Look at that crazy Diva Dance one.

We finalized the card with a really 3-dimensional one using Opus3D.
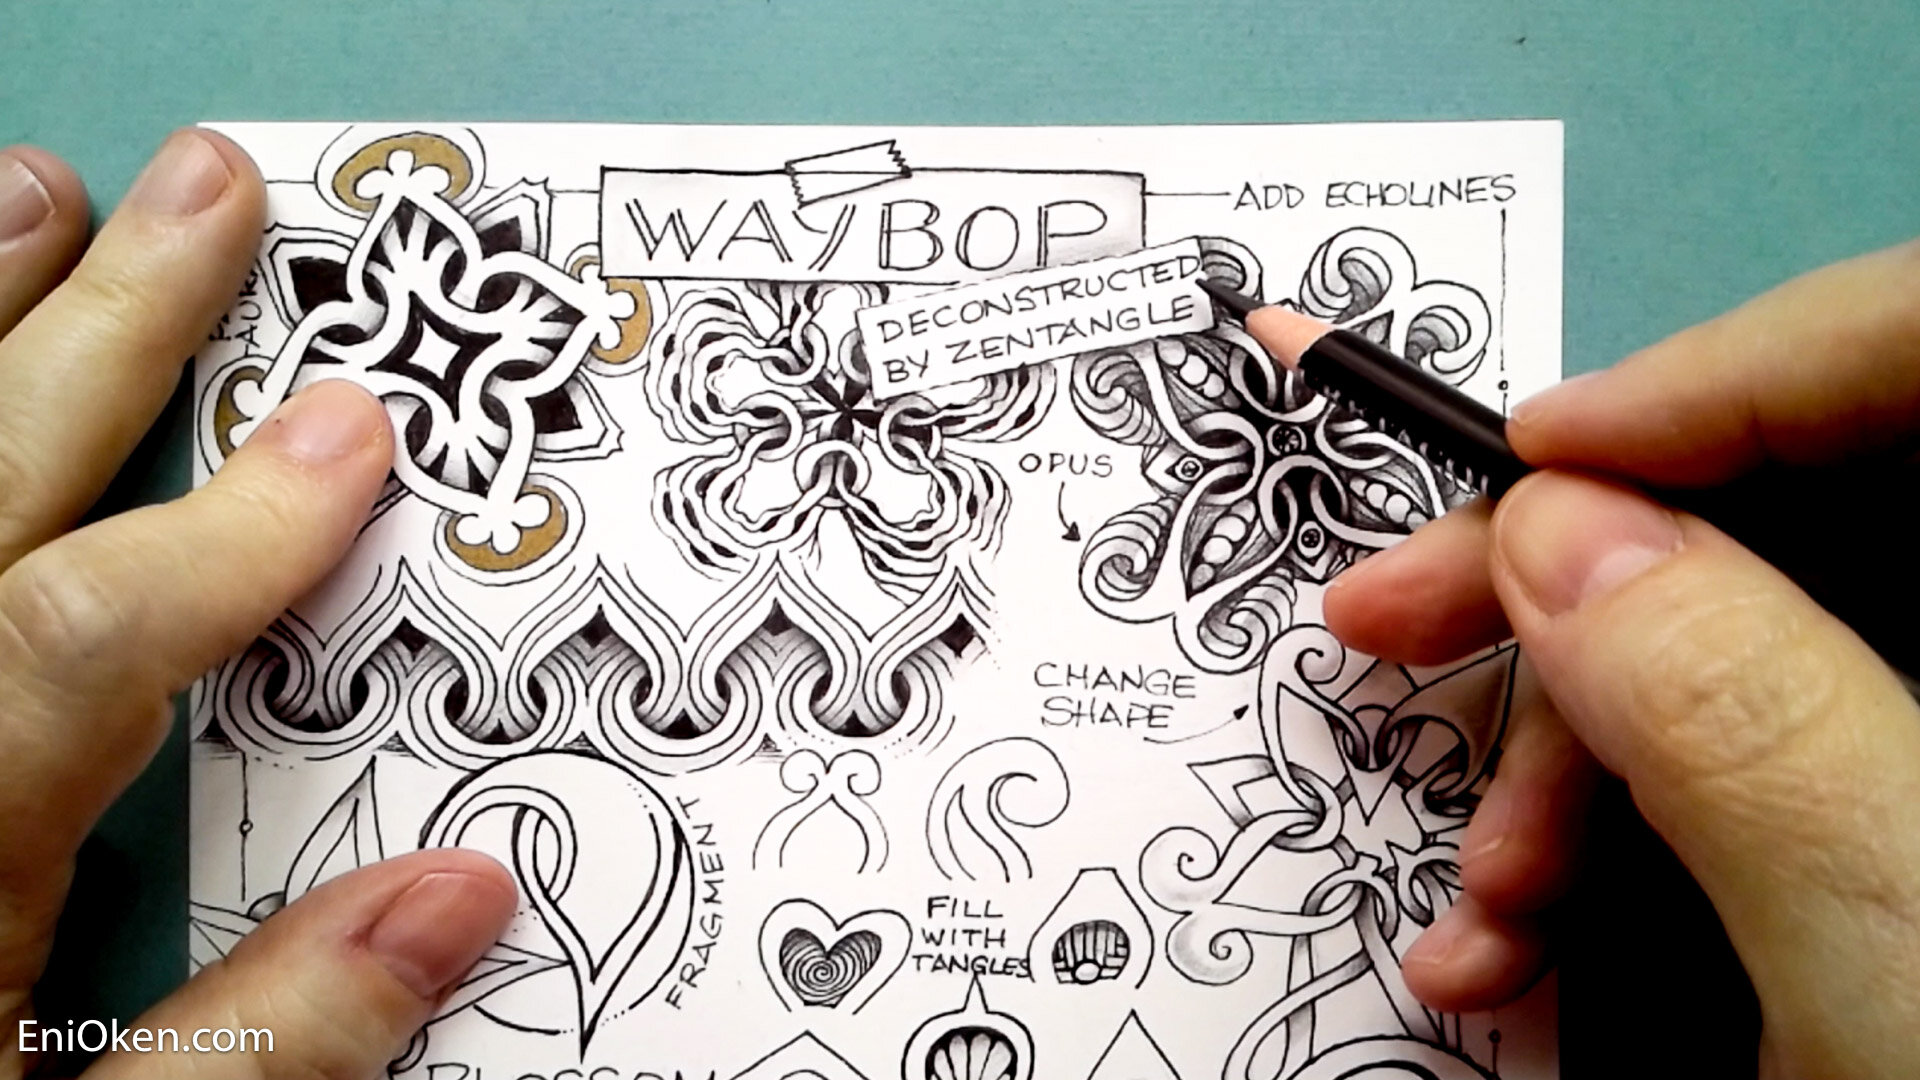
The final touch was to color the background in a specific way to give it interest, contrast and create that glow between the different samples.

Here's the final card again with all the pieces. What a FUN journey this was!

Feel free to pin or share these pictures.


This week I tried something I’ve wanted to try for a long while: using one of my old pictures as a string. I printed a previous picture very lightly over thick watercolor paper and proceeded to tangle over it, using my new favorite shading technique with brown inks. The picture took several days to finish and I will confess that it was a little too large for my taste (tangled area measures 4.5x7 inches). That’s a LOT of tiny tangling! But I’m happy with the result.